Kalaharipro
Members
-
Joined
-
Last visited
-
It is grid tied - PV first, then battery, then Escom. The panels are cleaned every 3 months or so - and in summer with rain most poop is also washed away. As I mentioned in the first post this scenario suddenly appeared in April after running perfectly for 908 days. Browsing through all the days since then there doesn't seem to be a 100% fixed pattern. Most days it occurs, sometimes for an hour then lines up with Pv 1 and then maybe drop again, today for example the drop was until the batteries were fully charged - ie the PV production "need" dropped. It sits mostly at a 600-700W drop in production, but sometimes it's 200-300w. Its never been more than 700w So its a bit random, when it does happen it is normally around 09:00 till batteries are full, and then after that it mostly tracks PV1, but not always - and not nearly as closely as what the Slave does. Slave is almost a carbon copy on PV1 and 2 - not at all the case on Master And as mentioned, nothing changed that I am aware of - not software or hardware, or any settings. Not sure if Deye has remote access and could have updates software etc?
-
Are you referring to these?


-
I managed to get two photos earlier today of the inverters in action. Master - PV2 shows the lower Watts created MASTER SLAVE The above was taken around 09:40 - graph below MASTER SLAVE


-
Ok thanks will go that route - but its a Deye unit, so will call them
-
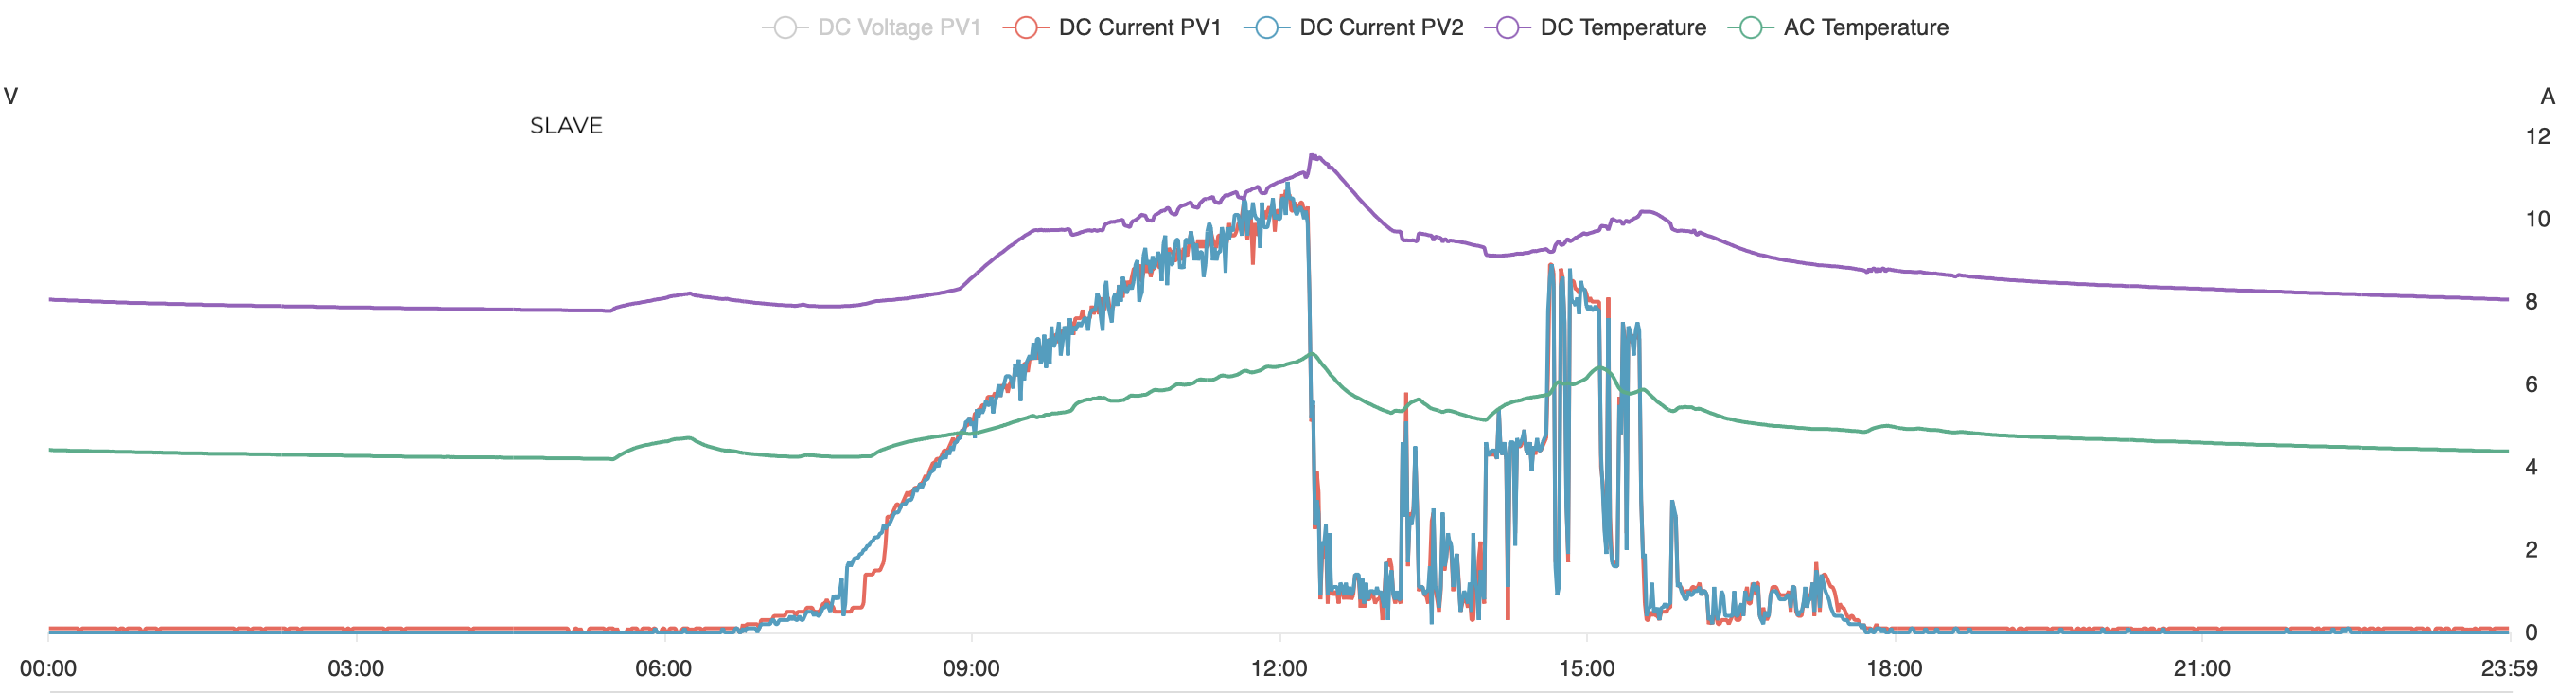
So since day 1 Slave has always run hotter than Master - so the slides below are inline with normal behavior as far as temperature goes. I don't see any correlation between the AC/DC temp and the drop in PV power 10 August MASTER Peak temperature DC 66 AC 55 SLAVE Peak temperature DC 95 AC 56


-
Thank you for the feedback so far. At one stage I thought it might be heat related, ie when it gets to a certain surface temp it looses some efficiency (which is generally true but then all panels becomes less efficient), but I started to watch that closely and even in that there was no consistency. It seems as if PV2 on Master struggle to keep the "load" consistently, but then again on some days it does. Could it be a loose connection that does it? Yesterday for example it was freezing cold with rain till around 14:00, then it was mostly fun sunshine. See how it "keeps up" in the cloudy and rainy weather, then totally fall back when the sun comes out, but at around 15:20 it then suddenly starts to track the PV1 almost to the tee.

-
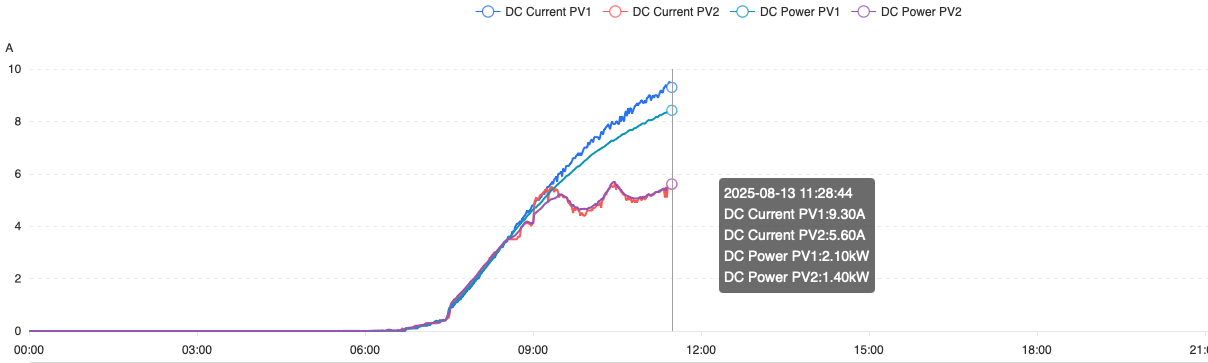
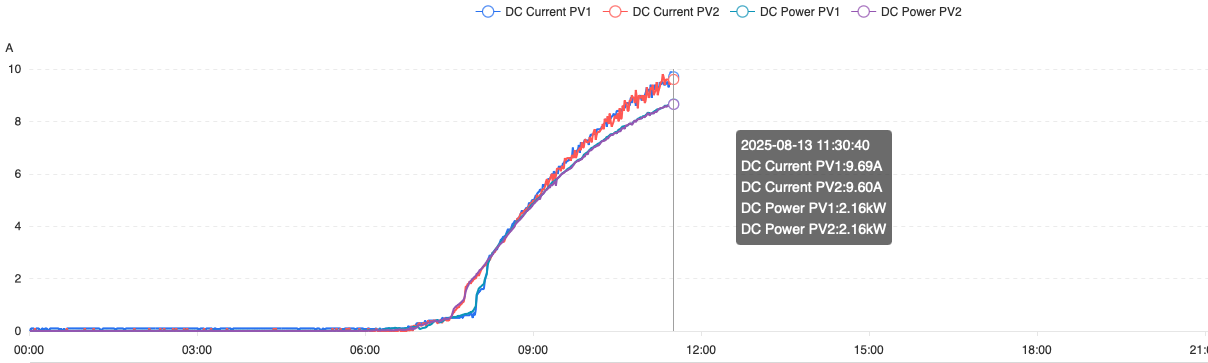
Good day First disclaimer, I am an enduser and not technically proficient on solar at all. So if what I am trying to explain makes no sense then please forgive me. I have two 5kw Deye single phase inverters, setup as master and slave, with that I have 24 x 455w panels, and 5 x 5kw batteries The system has been running for 1029 days and for the first 908 days the behavior described below did not occur Each inverter has 12 panels linked to it, and standing in front of them looking at their live performance the load is (up to date 908) equally balanced - PV/Grid/Load/Batteries. So the one does not work harder or perform better than the other. Then on 10 April this year the PV produced, suddenly started to show a difference, with the Master producing less - on ave around 700-800w, at times I did not do anything physically to the system, or to software, or to any setting - it just happened by itself as far as I can see. And also the all 24 panels are on the same level and angle, with zero shade on them during the day, so a shadow of a tree is not the issue I am not sure if I am looking at the correct stat, but going through the different options on the software I saw that on DC Current PV I could see the difference. I have no idea how the physical setup was done, but as explained both inverters have 12 panels, and somehow the "stats" see it as DC Current PV1 and DC Current PV2 for both inverters (so 4 sets of data for the 24 panels) So up to 10 April all PV DC stats were "perfectly aligned" on stats for both inverters - se below what I am trying to say Master Slave Master on 10 April Since then this has always been the case, with DC PV2 on the Master producing less (red line). Looking through all the days it seems to start in line with PV1, then drop off somewhere for a couple of hours and then catches up again by producing the same. Most days its not inline with PV1 - especially if you compare to how closely PV1 and 2 follows each other on the slave Here for example are the stats for this week Master Slave So the question is twofold. What is causing it to make me loose generating capacity of around 700-800w most days on Master for a couple of hours, and secondly how do I fix it?


-
Thanks for the feedback. I do not see that specific indication on mine (picture 4), but either way the explanation you give make sense thanks.
-
Good day Let me start off by saying I have a workaround for this issue, but surely it must be a glitch? Not that I am at all qualified in the field of PV, so my comments and deductions might be silly to the experts on this forum. In my limited technical understanding the setup of my solar system is as follows. 20x455w panels 2x5kw Deye inverters 5x5kw Greenrich batteries Setup to feed house 100% at all times - so nothing in the house excluded from getting electricity off the inverters. Only when battery and PV can't supply demand if would use Eskom My system is big enough to take me off grid about 85% of the time, which means my batteries are fully charged through the PV about 85% of the time. I like to run my system in a way to allow me absolutely minimum Escom dependancy, which obviously also equals very low Escom cost. Typically I will set all of my daytime zones to run down to 20% if need be, and only then start to use Escom if PV is not enough to handle the load at the time. So what I have noticed a few times now, and the first time it took me a good week to get the workaround going, is that if the batteries do not charge to 100% for more than 3 days in a row, then it starts to "ignore" my 20% setting. This typically happens when we have the type of weather currently in Gauteng where you have a number of days in a row where it rains and/or there is thick cloud cover. So what would happen is it would start to add 1%-2% a day (when it does not charge to 100%) to the 20% minimum and then starts to use Escom power. Just to be clear, it does not change the actual setting on the device, it just "dynamically" start to do its own thing and creates its own minimum. For example the first time this happened I had a week or so where I could not get enough sun to charge to a 100% SOC minimum set to 20% From about day 3 onwards this happens (I am fairly sure this does not happen in the first two days, but could be wrong) Day Setting Escom usage starts 2 20% 22% 3 20% 23.5% 4 20% 26% And so it increased daily up to around 31%, even though the minimum was set at 20% And then I got a full sunshine day, the system went back up to 100% and from there on the issue was resolved again. This has happened 3 times now in the last year or so, and there are two ways of "fixing" it, either you charge the batteries to 100% via Escom, or you let the sun take it back to 100% - both takes the issue away. So it seems as if the "self regulating" minimum appears after around 3 days of no full charge, and disappears as soon as the batteries have had a full charge. But as soon as we have not had full sunshine (like for the least couple of days) it does its own thing again. Maybe the system should work like this? Not sure if anybody else has had the same experience.
-
-
Agree fully. I suppose they get away with it because the system does function, and unless you really look into the detail of what is happening then most wont pick it up. I now for the first time have a true view of actual usage and my stats makes sense, compared to the meter stats. Even before all of this started there was a miss match between what the stats said I used as "Power Purchased" compared to what the actual meter reading was. I thought the stats were just incorrect (indicated 30-40% of actual usage), but now the "Power Purchased" stats align 100% with what the meter says.
-
UPDATE - Resolved So this is very early days but it seems as if the solution was the adding of a CT device on the DB board/inverter. In my limited technical understanding the setup of my solar system is as follows. 20x455w panels 2x5kw Deye inverters 5x5kw Greenrich batteries Setup to feed house 100% at all times - so nothing in the house excluded from getting electricity off the inverters. Only when battery and PV can't supply demand if would use Eskom Worked perfect until the whole situation on this topic started happening. First it was the roughly 300w per hour it pulled from Eskom, even though the setting was at 10w. And then in the last 2 weeks I went totally belly up and randomly used Eskom power - although the system did not show it - between 17kw and 30kw a day on meter which was not reflecting on system. So the simple solution was - install a CT on the board, and now everything works 100% as it should. I have almost zero movement on my Eskom meter, and the system does as it should. For the first time my "Power Purchased" stat is also accurate - used to show around 30-40% of what the meter showed I used. After a bit of Googling it seems as if it is not uncommon practise to run a solar system without a CT. In my case, for whatever reason, it is actually very necessary.
-
Thanks for all the responses, so let me explain in another very simplistic way what is happening here. I am not technical at all, so apologies if I frustrate you. So during autumn to spring my system is big enough to give me a 100% off the grid experience - I can literally disconnect Eskom power and not have a moment without electricity. Last year during the same period I went through 157 days of zero need for Eskom, but due to the importance of the trickle feed I obviously did attract some usage - something to the tune of 150w/h*24 = around 3-4 units a day. Post the master being replaced that suddenly jumped to double that, and now in the last 10 days it jumped to 17 units a day - with still zero actual need for Eskom power, and zero change to any setting (that I am aware of) The stats are also not reflective of what is really happening. The power usage patterns in my house has not changed but yet the stats for Grid usage, as well as Consumption in the house has dropped by between 700w and 1kw/h - as per the stats. So having read my meter this morning compared to 10 days ago, I used 170 units of Eskom power. That is nowhere to be found on the stats and on the active displays, but the house is using it. So I am still using around 37-42 kwh per day, but the inverter stats recons its only 23-30. In short my total usage per day has remained unchanged, but the stats shows differently - and Eskom is smiling. Whatever is causing that to happen I have no clue, and that applies to Deye as well as my installer. So from the stats there are only 2 things that is factually visible - on 21 May at 13:30 my issue of 300w-350w trickle feed (original issue after replacement) suddenly went away and become 0-2w trickle feed, at the very same time my illustrated usage fell by 700w-1kwh. It looks as if the PV and battery stats remained accurate.
-
Thanks, that's a bit too technical for me though. I am limited to operating the touch screen - but thanks anyway!
-
So I have set it to load first - it was on battery first. Also took 2 pictures just now of some settings - as well as what the dials are showing. Notice no usage in house - totally wrong, many things running, should be around 2kw+. Both investors shows the same - zero for house


-
I am in the East of Pretoria, close to Centurion