MarkPettit
Members
-
Joined
-
Last visited
-
Greetings again. I now have my setup (described above) fully running off a single pi (actually a Pi4). As can be expected, there were a few bugs, so I'll be adding the latest code base below again. However, before then I'll describe the exact steps I did. As the pi generally uses a SD card, and these things are notoriously slow and have limited write/rewrite capability, the use of a ramdisk for frequently updated items (csv log file and png graphs) is encouraged. However, if you are running from an actual hard disk, or SSD, this step is not required. The downside of this is that IF the pi is rebooted, the stats for the current day will likely be lost. A shutdown task which saves the log might help, but a direct power down by pulling the plug will not save you. Do note that the ss.py program uses a hardwired IP address for the mbusd process - this works just fine on my setup - but is highly unlikely to work on yours - so you must modify that setting. If you have everything running on a single machine, you may be able to set that to "127.0.0.1" - I guess it depends on the mbusd process. Create a mount point : "mkdir /ramdisk" You will either need to be root or sudo'd In /etc/fstab add a line like this : none /ramdisk tmpfs defaults,nodev,nosuid,noexec,nodiratime,size=256M 0 0 For our purpose (1 days logs and 2 png graphs), you really won't need more than 32M "memory". Either reboot, or force mount with "mount /ramdisk". The 2 programs use the following common code : RPT_DIR = "/ramdisk/SunSynk" HTML_DIR="/ramdisk/SunSynk" ARCH_DIR="/home/pi/SunSynk" If you do not use a ramdisk, you can modify the code to use a single common directory. Or the scripts can be started with optional arguments to force different settings. Create an archive directory : mkdir -p /home/pi/SunSynk Initialise the system : run 'init_ss.sh'. This simply creates /ramdisk/Sunsynk. We need to do this at first start, but also at every reboot - so in the crontab we add this line : @reboot /home/pi/init_ss.sh Now that we have the directories ready, and we have the mbusd daemon running (described by other experts in other articles), we need to start the stats gathering process. This can be done many ways (systemd, rc scripts, etc), but I like things simple, so add this to the crontab : @reboot /home/pi/run_ss.sh The above script will simply start the python progam - and upon failure, force a restart. At this stage a reboot is probably best, so we can test the start-up sequence, and to make sure it actually starts writing data into the ramdisk directory. If you can see the csv log file growing (do a tail -f on it), then we can start looking at creating graphs. For this, add the following line into the crontab : */1 * * * * /home/pi/ss_graph.py >> /ramdisk/SunSynk/graph.log This will create the graphs every ONE minute. These files will be in HTML_DIR. Now - I used nginx to display the data - you may need to adjust if you use apache or something else. Place yourself into the /var/www/html directory Copy the file below - power.html - to here. The create some soft links to get around permission issues : ln -s /ramdisk/SunSynk/power_consumption.png power_consumption.png ln -s /ramdisk/SunSynk/power_supply.png power_supply.png ln -s /ramdisk/SunSynk/system_state_detailed.html system_state_detailed.html ln -s /ramdisk/SunSynk/system_state_summary.html system_state_summary.html The above steps are a once-off. After 2/3 minutes you should be able to visit the web pages. These pages automatically refresh after a useful interval - so they can be left open on some screen. http://YOUR.PI.IP/power.html http://YOUR.PI.IP/system_state_detailed.html http://YOUR.PI.IP/system_state_summary.html At the end of the day, a new csv log file will be created. The previous day will be gzip compressed. The graphing program can be passed an optional date - and it will automatically uncompress if needed. At this point you can force the png graphs to go somewhere else. power.html run_ss.sh init_ss.sh ss_graph.py ss.py
-
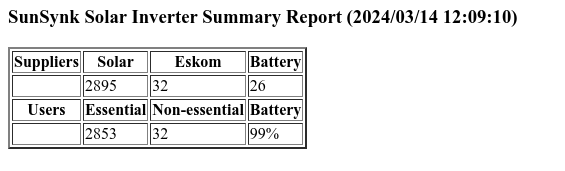
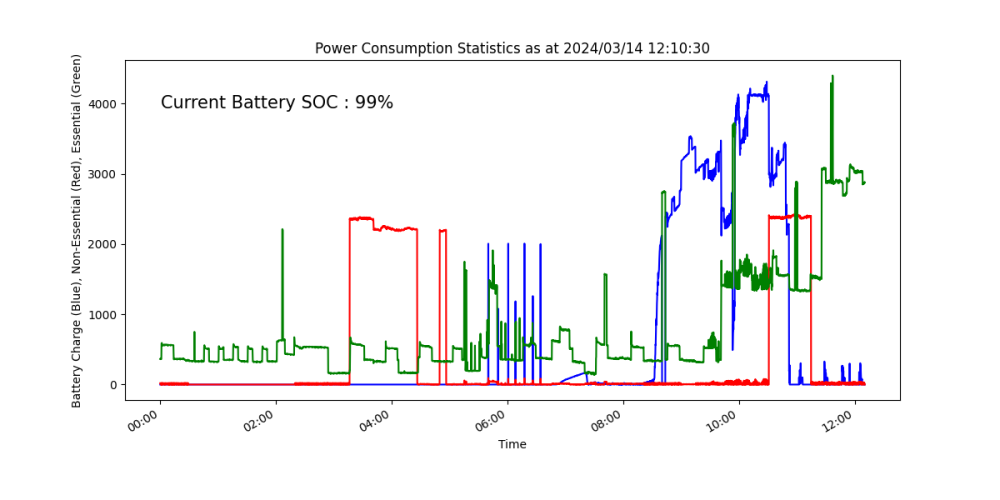
Greetings good folk. First time writing here, but been lurking for well over a year. I've had my SunSynk 8.8kw inverter for the duration of that time, but only got solar panels about a month back. I've been keen to get some stats and graphs, but as long as the setup was just for the avoidance of load-shedding, there wasn't really much motivation. I dabbled around with the Home Assistant setup - but it took a chunk of time to get even the most basic setup going. I started studying all the code and pretty quickly came to the conclusion that it's all just way too complex. I'm really not interested in fancy graphs, blinking lights and sexy fonts. I'm a numbers guy - just the basic facts please. I'm also a professional programmer, with 40+ years experience, going from assembler on mainframes in the 80s, to C on Unix in the 90's, to Python on Linux in the 00's to now. I tried to see if I could get it all going in a MUCH simpler fashion - no Home Assistant, no NodeRed, no Mosquito, no containers, no databases ... in short : simple Python. My little system requires this : a raspberry pi (3+ is fine), mbusd and a rs485-usb dongle. That is it. I wrote 2 programs : ss.py connects to the mbusd and pulls down the register values, logging them to simple csv files and also 2 small summary html files; ss_graph.py reads the logged files and creates 2 matplotlib graphs, saved as png files suitable for looking at on a web page. That's it. The 2 python modules that are not batteries-incuded and need to be installed manually (pip3 install...) are pyModbusTCP and matplotlib. Please find attached some screenshots of my simple web views, the graphs for today, an extract of the log file, and then the source code. License : I am a true believer in the power of the GNU licenses. So the code is licensed as GPL3. I did obtain the register settings by studying KellerZA code and documentation - thank you - your codebase is inspirational. To get it working, you must have mbusd installed and running exactly as all the documentation in the forum here shows. As a test, you can run ss.py from the command line and then within a few minutes it should start populating the csv log files. Once you have data, you can graph it by running ss_graph.py. Then view the png file as you please. The work is a bit rough at the moment - I've concentrated on getting it to meet MY needs. If this coincides with YOUR needs, feel to use and abuse as you wish, albeit respecting the license. What's not done yet is a fancy wraparound setup. I envisage running this from cron on a pi. I would write the day log file and graphs to a ramdisk. I would get a simple web page setup going on nginx to pick up the generated html files, as well as some new ones to show the graphs. The graphs can be generated every few seconds. The logging can be done frequently - any value that is a factor of 60 (ie 2,3,4,5,6,10,12,15,20,30) seconds. This is an ongoing development - but the attached below is my first dump. ss_graph.py ss.py