slipx
Members
-
Joined
-
Last visited
Everything posted by slipx
-
Not really. The plumbers did it when they installed the gas geyser. You just need to install a bypass value to isolate the gas geyser if ever needed
-
Hi All Just a heads up that if you are running a legacy browser as defined by Home Assistant then the card will no longer render correctly if you update to version 2024.8.0. This affects older iPads and some older android tablets running custom cards. The reason is that they do not support dynamic CSS and dynamic styles which is used extensively by the card. The effort to fix this is extensive and not really feasible. The work around is to either: Stay on 2024.7.4 Upgrade your device/browser to a modern version Try change/spoof your user agent string For reference the following are considered legacy browsers according to the new rules Browser Legacy Current Modern New Modern Android 60 63 115 Chrome 60 63 109 Edge 16 79 115 Firefox 52 67 115 iOS 10.3 13 15.6 Safari 11 13 16.6 Opera 47 50 101 Opera Mobile* - 80 80 Samsung 4 8.2 22
-
The daily reset at midnight is expected. I meant for those instances where there is a mismatch can you see an abnormal reset in the sensor value where it starts counting again which would cause the under reporting.
-
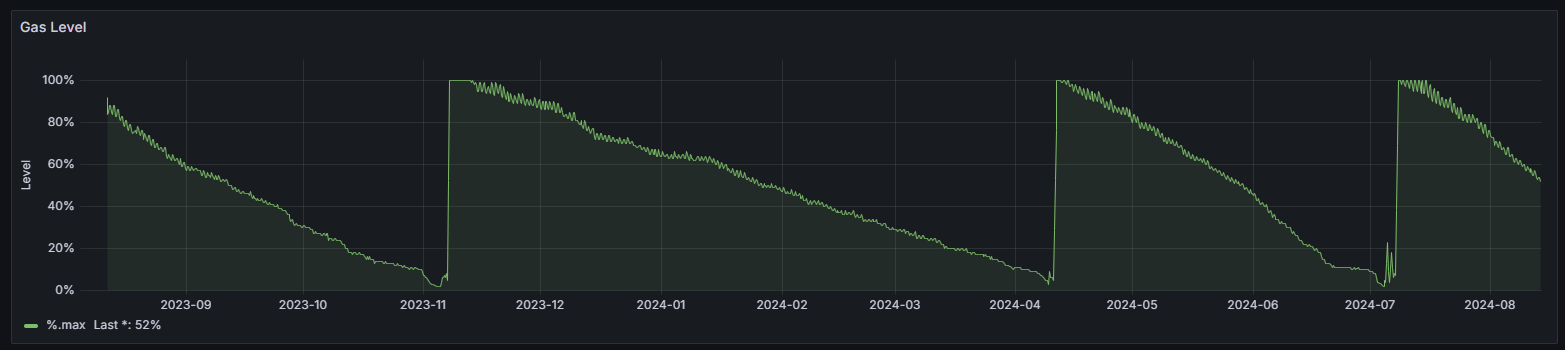
We have a 20L/min Paloma gas geyser that is connected in series to our electric geyser. It only turns on if the temp of the incoming water (output from electric geyser) is below 55 degrees. I run the electric geyser during the day if there is sufficient solar otherwise it stays off. We have roughly 2 baths and 1 shower a day plus the stove and oven run off gas and are used daily. This is how long a 48kg cylinder lasts.
-
@RobO When you click on that sensor in home assistant what does the state history graph look like. Does it reset to zero at some stage and start calculating again? You can also create energy meters on the ESP32. They tend to be a more reliable than the those daily registers which tend to reset themselves every now and then https://github.com/slipx06/Sunsynk-Home-Assistant-Dash/blob/a3f9d4c4b93b31a24c84bc2c15fda4fc7ff496f5/ESPHome-1P-Sunsynk-Deye.yaml#L1019-L1033
-
https://thehackernews.com/2024/08/researchers-uncover-vulnerabilities-in.html
-
I've moved away from apex charts in the updated version but you can adjust the card height under breakpoint 1000
-
Nothing was added to my statement
-
I never bought in July. I bought R400 in August to test and the R230 from July did not carry over. I received my 62.5 units
-
@Muttley it uses the function below to generate that data. Assumes that your sensors are named correctly i.e. sensor.ss_prog1_time sensor.ss_prog2_time sensor.ss_prog3_time ...etc number.sunsynk_prog1_capacity number.sunsynk_prog2_capacity number.sunsynk_prog3_capacity ...etc If not, you need to update the sensor names in the function const startTimeString = hass.states[`sensor.ss_prog${start}_time`].state; const endTimeString = hass.states[`sensor.ss_prog${end}_time`].state; const capacity = parseFloat(hass.states[`number.sunsynk_prog${cap}_capacity`].state); Function below fn: | $fn({hass, vars}) => { vars.computeAll = () => { const timeSlots = [ {start: 1, end: 2, cap: 1}, {start: 2, end: 3, cap: 2}, {start: 3, end: 4, cap: 3}, {start: 4, end: 5, cap: 4}, {start: 5, end: 6, cap: 5}, {start: 6, end: 1, cap: 6} ]; const now = new Date(); const xs = []; const ys = []; timeSlots.forEach(({start, end, cap}) => { const startTimeString = hass.states[`sensor.ss_prog${start}_time`].state; const endTimeString = hass.states[`sensor.ss_prog${end}_time`].state; const capacity = parseFloat(hass.states[`number.sunsynk_prog${cap}_capacity`].state); const [startHours, startMinutes] = startTimeString.split(':').map(Number); const [endHours, endMinutes] = endTimeString.split(':').map(Number); const startTime = new Date(now.getFullYear(), now.getMonth(), now.getDate(), startHours, startMinutes); let endTime = new Date(now.getFullYear(), now.getMonth(), now.getDate(), endHours, endMinutes); if (endTime < startTime) { endTime.setDate(endTime.getDate() + 1); } xs.push(startTime, endTime); ys.push(capacity, capacity); }); return { xs, ys }; } } I found it useful to also add the grid power to the chart. Just add the entity below to the chart config. I've updated the Dashboard on GitHub with the latest code - entity: sensor.sunsynk_grid_ct_power name: | $fn ({ ys,meta }) => "Grid" + "💡" + "(" +ys[ys.length - 1]+"W)" fill: tozeroy line: color: rgb(84, 144, 194)
-
It does help. You always have to pay the fixed cost as it carries over each month, but you are not forced to buy units when you pay in arrears. Look at the calcs. In August you pay R630. They deduct the outstanding July, then you pay for August. At least that's how I understand it
-
Was looking at a some options to reduce fees since I'm a low use user as well. Assuming you pay each month and want to cover the service fee Paying every other month to cover service fee and top up


-
I suppose if you only want to pay the fixed fee you would need to pay for each month in arrears i.e. R230 in August for July, R230 in September for August etc.
-
Do you see the same behavior on the Sunsynk portal? How are you powering the ESP32?
-
Hi. Which are the specific registers that are giving you incorrect readings.
-
@Zodiac69 Nice. What pins did you use to connect the RJ11 cable to the ESP32 and what baud rate? uart: tx_pin: GPIO1 rx_pin: GPIO3 baud_rate: 9600
-
Hi @Zeus-JKR You have not provided a sensor for `nonessential_power`. The card calculates this using the formula nonessential = grid_ct_power_172 - grid_power_169. Your grid power is 0 and grid_power_169 is 464W. You can either provide your own sensor for nonessential_power or make sure that the sensor you are using for grid_power_169: sensor.deye_sunsynk_sol_ark_grid_power is the expected measurement point. Have a look at the docs https://slipx06.github.io/sunsynk-power-flow-card/configuration.html and existing closed issues https://github.com/slipx06/sunsynk-power-flow-card/issues?q=is%3Aissue+is%3Aclosed and discussions https://github.com/slipx06/sunsynk-power-flow-card/discussions for further help and info.

-
HI. I use it without an API key so did not chose any options.
-
@rgt.dnl I created my own template sensor that sums the data from two arrays and adjusted how the attributes are created. If you are using the default integration sensor then replace the filters for each entity in the graph filters: - fn: | ({meta}) => ({ xs: meta.wh_period.map(({ start }) => new Date(start)), ys: meta.wh_period.map(({ value }) => value), }) with filters: - fn: | ({meta}) => { const entries = Object.entries(meta.wh_period); const xs = entries.map(([start, _]) => new Date(start)); const ys = entries.map(([_, value]) => value); return { xs, ys }; } I've updated the code on GitHub
-
In that case we would need to combine all the data points into a single array as one entity. Here is the updated code type: custom:plotly-graph hours_to_show: current_day title: System Timer time_offset: 1h refresh_interval: auto fn: | $fn({hass, vars}) => { vars.computeAll = () => { const timeSlots = [ {start: 1, end: 2, cap: 1}, {start: 2, end: 3, cap: 2}, {start: 3, end: 4, cap: 3}, {start: 4, end: 5, cap: 4}, {start: 5, end: 6, cap: 5}, {start: 6, end: 1, cap: 6} ]; const now = new Date(); const xs = []; const ys = []; timeSlots.forEach(({start, end, cap}) => { const startTimeString = hass.states[`sensor.ss_prog${start}_time`].state; const endTimeString = hass.states[`sensor.ss_prog${end}_time`].state; const capacity = parseFloat(hass.states[`number.sunsynk_prog${cap}_capacity`].state); const [startHours, startMinutes] = startTimeString.split(':').map(Number); const [endHours, endMinutes] = endTimeString.split(':').map(Number); const startTime = new Date(now.getFullYear(), now.getMonth(), now.getDate(), startHours, startMinutes); let endTime = new Date(now.getFullYear(), now.getMonth(), now.getDate(), endHours, endMinutes); if (endTime < startTime) { endTime.setDate(endTime.getDate() + 1); } xs.push(startTime, endTime); ys.push(capacity, capacity); }); return { xs, ys }; } } entities: - entity: sensor.sunsynk_battery_soc name: | $fn ({ ys,meta }) => "SOC" + "🔋" + "(" +ys[ys.length - 1]+"%)" line: color: red shape: spline width: 1 fill: tozeroy fillcolor: rgba(255,0,0, 0.3) show_value: true texttemplate: '%{y}' - entity: sensor.sunsynk_solar_power name: | $fn ({ ys,meta }) => "Solar" + "🔆" + "(" +ys[ys.length - 1]+"W)" line: color: rgb(255, 155, 48) shape: spline width: 1 fill: tozeroy fillcolor: rgba(255, 155, 48, 0.3) yaxis: y2 show_value: false showlegend: true - entity: sensor.sunsynk_combined_capacity name: | $fn ({ ys, meta }) => "Prog Capacity" line: color: rgb(30, 144, 255) width: 2 fillcolor: rgba(30, 144, 255, 0.6) show_value: true unit_of_measurement: '%' filters: - fn: ({ vars }) => vars.computeAll() layout: showlegend: true yaxis: nticks: 20 range: - 0 - 105 fixedrange: true yaxis2: range: - 0 - 6600 fixedrange: true xaxis: nticks: 9 tickangle: 0 config: scrollZoom: false

-
@rgt.dnl glad you sorted it out. Btw I've moved over to the Open Meteo solar forecast https://github.com/rany2/ha-open-meteo-solar-forecast. It allows for more api calls and you can add multiple arrays. I've also moved the graph to plotly. The code is on the GitHub.

-
Hi @RoganDawes I finally got around to graphing this. Its not interactive but does allow you to visualize what you were describing. The time slots are the blue bars and their corresponding capacity (SOC) setting. I've overlayed current SOC and Solar. Since my first slot starts at 1:00am I've shifted the plot over an hour (time_offset). You would need to adjust this setting. There is also a function that generates the program times. It assumes your sensors are named accordingly sensor.ss_prog${start}_time sensor.ss_prog${end}_time number.sunsynk_prog${cap}_capacity With the variables start, end and cap. Calling the function '({vars}) => vars.compute({start: 1, end: 2, cap: 1})' results in: sensor.ss_prog1_time sensor.ss_prog2_time number.sunsynk_prog1_capacity type: custom:plotly-graph hours_to_show: current_day title: System Timer time_offset: 1h refresh_interval: auto fn: | $fn({hass, vars}) => { vars.compute = ({start, end, cap}) =>{ const startTimeString = hass.states[`sensor.ss_prog${start}_time`].state; const endTimeString = hass.states[`sensor.ss_prog${end}_time`].state; const capacity = parseFloat(hass.states[`number.sunsynk_prog${cap}_capacity`].state); const now = new Date(); const [startHours, startMinutes] = startTimeString.split(':').map(Number); const [endHours, endMinutes] = endTimeString.split(':').map(Number); const startTime = new Date(now.getFullYear(), now.getMonth(), now.getDate(), startHours, startMinutes); let endTime = new Date(now.getFullYear(), now.getMonth(), now.getDate(), endHours, endMinutes); if (endTime < startTime) { endTime.setDate(endTime.getDate() + 1); } return { xs: [startTime, endTime], ys: [capacity, capacity] }; } } entities: - entity: sensor.sunsynk_battery_soc name: | $fn ({ ys,meta }) => "SOC" + "🔋" + "(" +ys[ys.length - 1]+"%)" line: color: red shape: spline width: 1 fill: tozeroy fillcolor: rgba(255,0,0, 0.3) show_value: true texttemplate: '%{y}' - entity: sensor.sunsynk_solar_power name: | $fn ({ ys,meta }) => "Solar" + "🔆" + "(" +ys[ys.length - 1]+"W)" line: color: rgb(255, 155, 48) shape: spline width: 1 fill: tozeroy fillcolor: rgba(255, 155, 48, 0.3) yaxis: y2 show_value: false showlegend: true - entity: number.sunsynk_prog1_capacity line: color: rgb(30,144,255) width: 1 fill: tozeroy fillcolor: rgba(30,144,255, 0.6) showlegend: false filters: - fn: '({vars}) => vars.compute({start: 1, end: 2, cap: 1})' - entity: number.sunsynk_prog2_capacity line: color: rgb(30,144,255) width: 1 fill: tozeroy fillcolor: rgba(30,144,255, 0.9) showlegend: false filters: - fn: '({vars}) => vars.compute({start: 2, end: 3, cap: 2})' - entity: number.sunsynk_prog3_capacity line: color: rgb(30,144,255) width: 1 fill: tozeroy fillcolor: rgba(30,144,255, 0.7) showlegend: false filters: - fn: '({vars}) => vars.compute({start: 3, end: 4, cap: 3})' - entity: number.sunsynk_prog4_capacity line: color: rgb(30,144,255) width: 1 fill: tozeroy fillcolor: rgba(30,144,255, 0.9) showlegend: false show_value: false filters: - fn: '({vars}) => vars.compute({start: 4, end: 5, cap: 4})' - entity: number.sunsynk_prog5_capacity line: color: rgb(30,144,255) width: 1 fill: tozeroy fillcolor: rgba(30,144,255, 0.7) showlegend: false filters: - fn: '({vars}) => vars.compute({start: 5, end: 6, cap: 5})' - entity: number.sunsynk_prog6_capacity line: color: rgb(30,144,255) width: 1 fill: tozeroy fillcolor: rgba(30,144,255, 0.9) showlegend: false filters: - fn: '({vars}) => vars.compute({start: 6, end: 1, cap: 6})' layout: showlegend: true yaxis: nticks: 20 range: - 0 - 105 fixedrange: true yaxis2: range: - 0 - 6600 fixedrange: true xaxis: nticks: 9 tickangle: 0 config: scrollZoom: false

-
@IggyP You can modify your ESP home config: - platform: modbus_controller # 672 PV1 Power modbus_controller_id: sunsynk name: "${friendly_name} PV1 Power" id: sunsynk_esphome_pv1_power register_type: holding address: 672 unit_of_measurement: "W" accuracy_decimals: 0 device_class: power state_class: measurement filters: - multiply: 10 - platform: modbus_controller # 673 PV2 Power modbus_controller_id: sunsynk name: "${friendly_name} PV2 Power" id: sunsynk_esphome_pv2_power register_type: holding address: 673 unit_of_measurement: "W" accuracy_decimals: 0 device_class: power state_class: measurement value_type: U_WORD filters: - multiply: 10
-
If it’s consistently out by a factor of 10 then that’s a quick fix.
-
I cant see anything wrong. Everything looks good. What does the deye cloud report?